By default Playtime is the selected stat category when opening the Stats Page. Tapping the Playtime graph or text under it will reveal more detailed playtime stats when a different stat category is selected.
¶ Playtime Panel
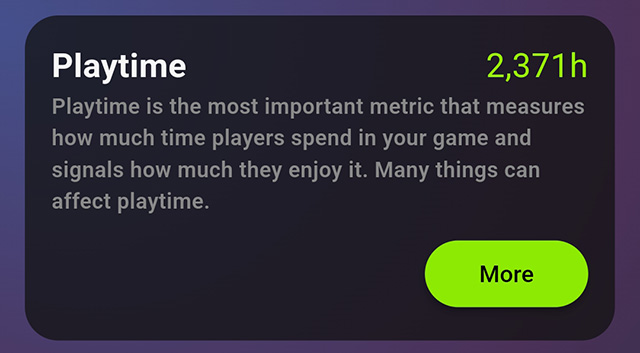
This panel shows the total playtime for the selected version of your game.
Tap the More button to access tips on How to Improve Playtime for Your Games.
¶ Playtime Stats
¶ Playtime
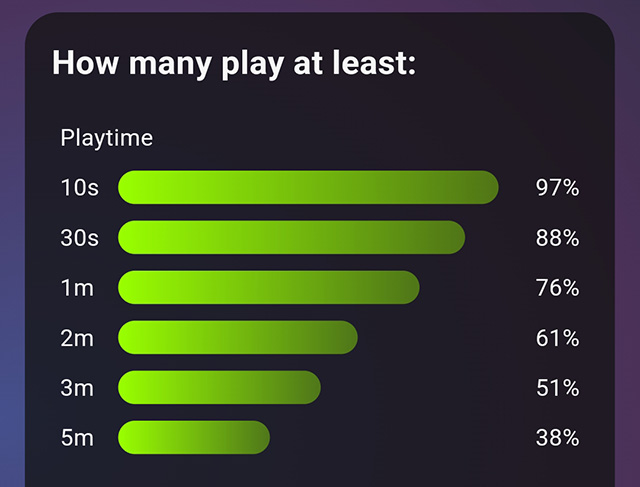
Playtime shows you the percentage of players who reach playtime milestones in your game. Those milestones are 10 seconds, 30 seconds, 1 minute, 2 minutes, 3 minutes and 5 minutes.
This can help reveal dropoff points where you may be losing players.
¶ Average Session Playtime
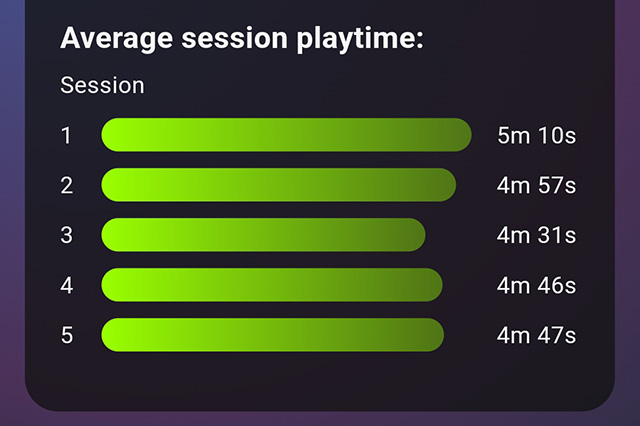
Average Session Playtime shows the average playtime of players on their first through fifth sessions.
This can help reveal how much replay value your game has.
¶ Playtime Graphs
The playtime graphs provide a more detailed view of stats to help identify areas of improvement in your game.
¶ Overall Playtime Graph
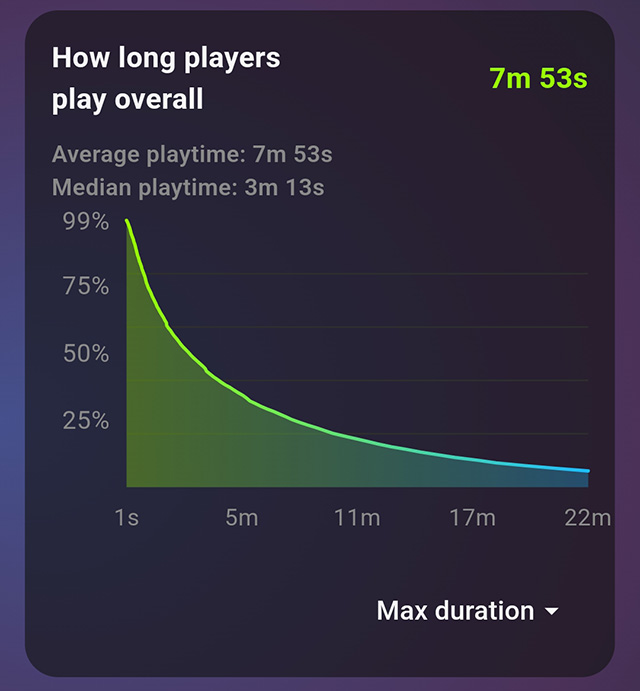
The green number on the right is the average amount of time a player spends in your game.
Above the graph are displayed the average playtime as well as the median* playtime.
The vertical axis represents all players who have played your game while the horizontal axis represents total playtime.
You can tap or drag along the line to view the exact metrics at any given point.
Tap the dropdown menu in the lower right to reduce the amount of total playtime displayed on the horizontal axis. Showing less total playtime gives a more detailed view of player's playtime during the first minutes of your game.
This graph can be excellent at revealing points in your game where it loses players.
¶ One Attempt Playtime Graph
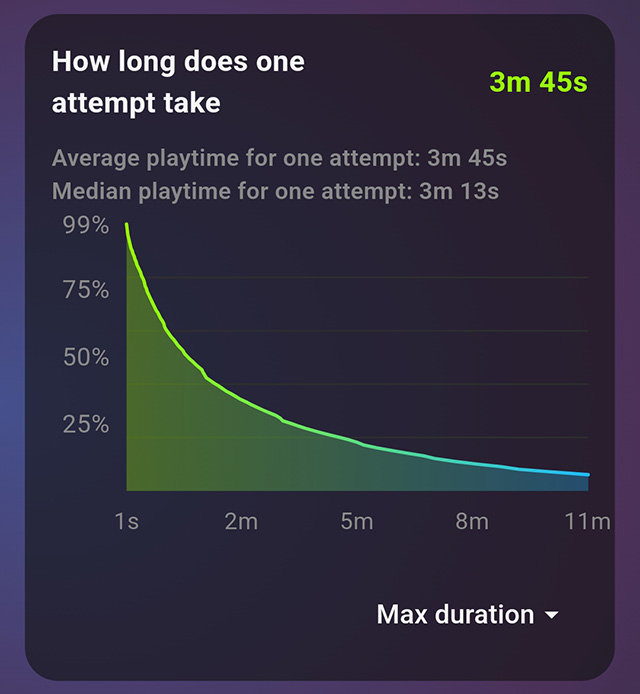
This graph displays playtime by attempts.
The green number on the right displays the average time 1 attempt at your game takes.
Above the graph are displayed the average attempt playtime as well as the median* attempt playtime.
The vertical axis represents the total number of attempts while the horizontal axis represents how long each attempt takes.
You can tap or drag along the line to view the exact metrics at any given point.
Tap the dropdown menu in the lower right to reduce the amount of total playtime displayed on the horizontal axis. Showing less total playtime gives a more detailed view of player's playtime during the first minutes of each attempt.
¶ Score Graph
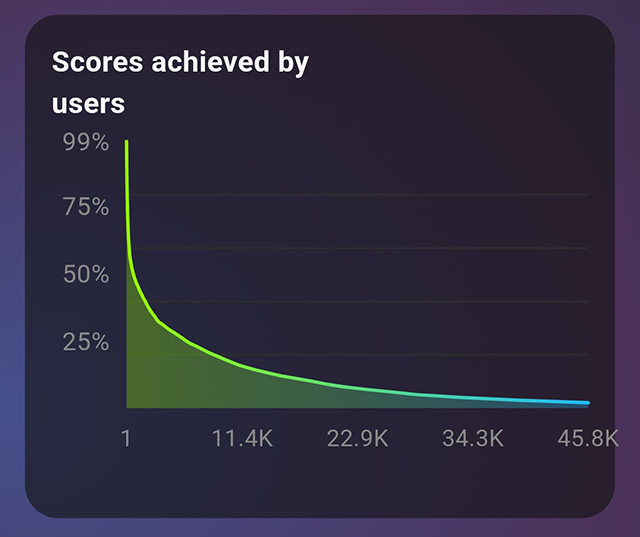
The score graph displays the scores achieved by all players of your game.
The vertical axis represents the total number of players while the horizontal axis represents the scores achieved.
You can tap or drag along the line to view the exact metrics at any given point.
¶ Clips
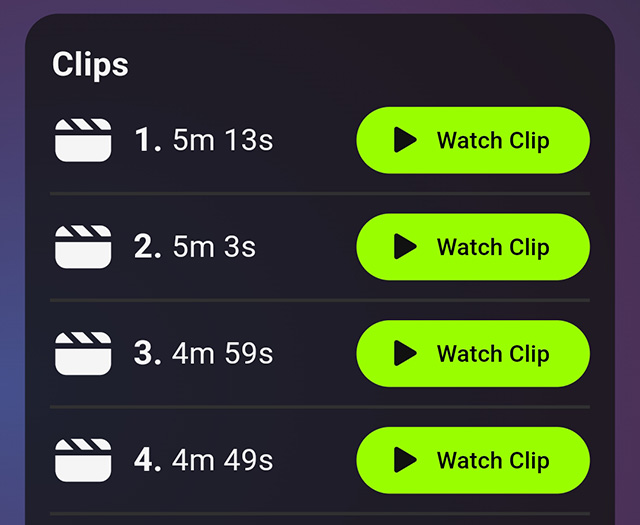
This panel provides viewable replays of players playing the selected version of your game.
Watching replays is an excellent way of seeing how players engage with your games, difficulties they may encounter and areas of improvement to make your game more enjoyable for players.
¶ Survey Answers
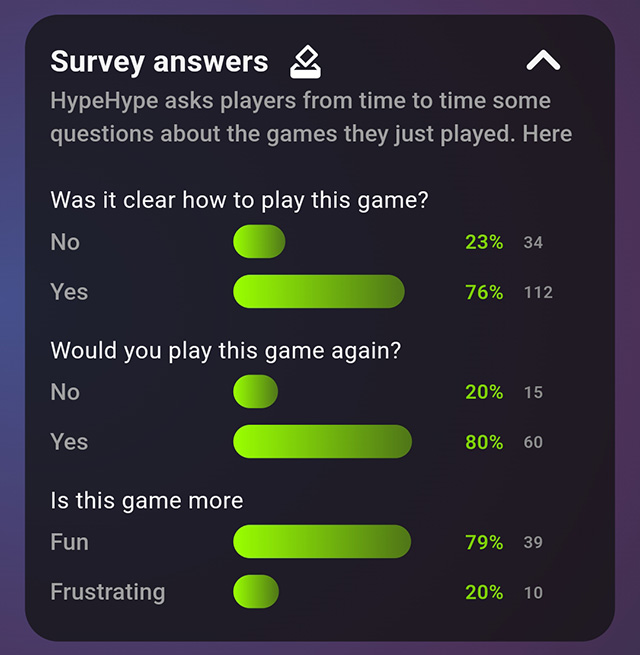
Every so often HypeHype will pop up a short survey to your players and ask them about their experience. This feedback can be a great source of information and give you a insights into key areas and sentiment. Make sure you check this regulary to see how your players are responding.
¶ *What is Median?
The term median refers to the middle number in a sorted ascending or descending list of numbers and can be more descriptive of that data set than the average. It is the point above and below which half (50%) of the observed data falls, and so represents the midpoint of the data.
¶ Related Topics
Creator Digest Stats Page Retention Page Appeal & Marketability Stats Performance Stats